Record fall in number of new property listings across New Zealand for month of July
Auckland sits between a sellers’ and buyers’ market
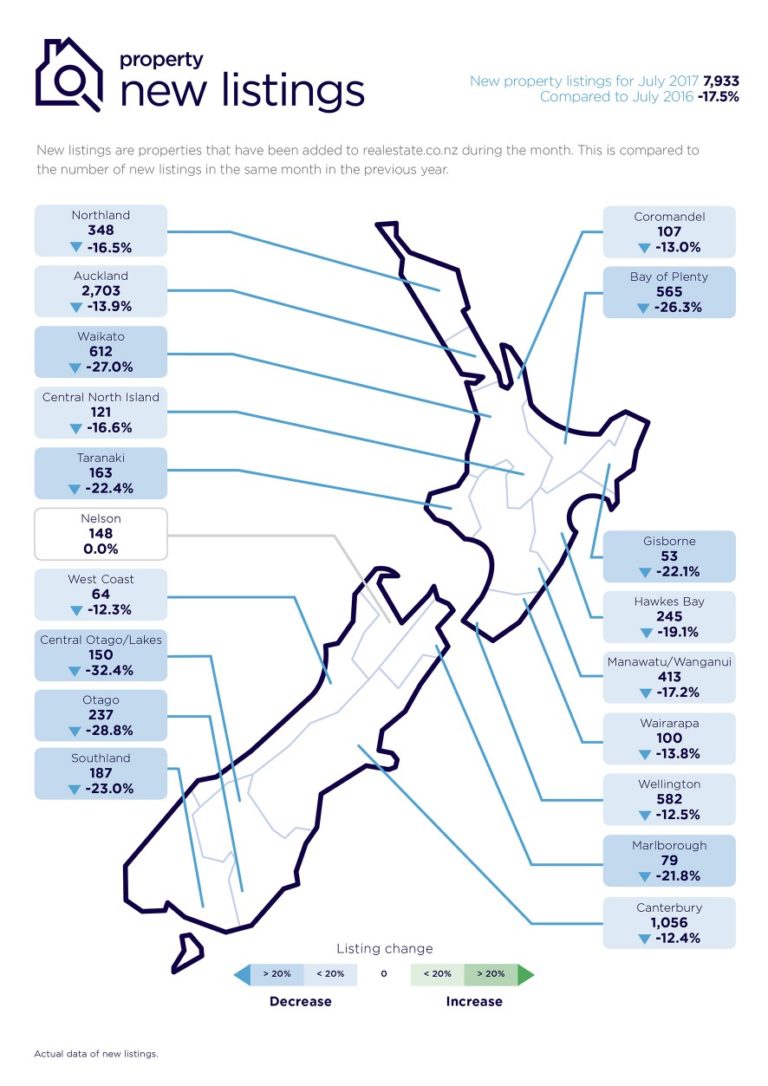
Real time statistics from realestate.co.nz show that last month new listings fell by 17.5 per cent nationally compared to the same period in 2016, while prices in most regions remained relatively stable.
“In July 2017, only 7,933 new listings came onto the market across the whole country, which is the lowest number in any July month since our records began in 2007,” says realestate.co.nz spokesperson Vanessa Taylor.
Of the 19 regions in New Zealand, all but one region (Nelson which remained static) experienced a decline in the number of new listings in July compared to the previous year.
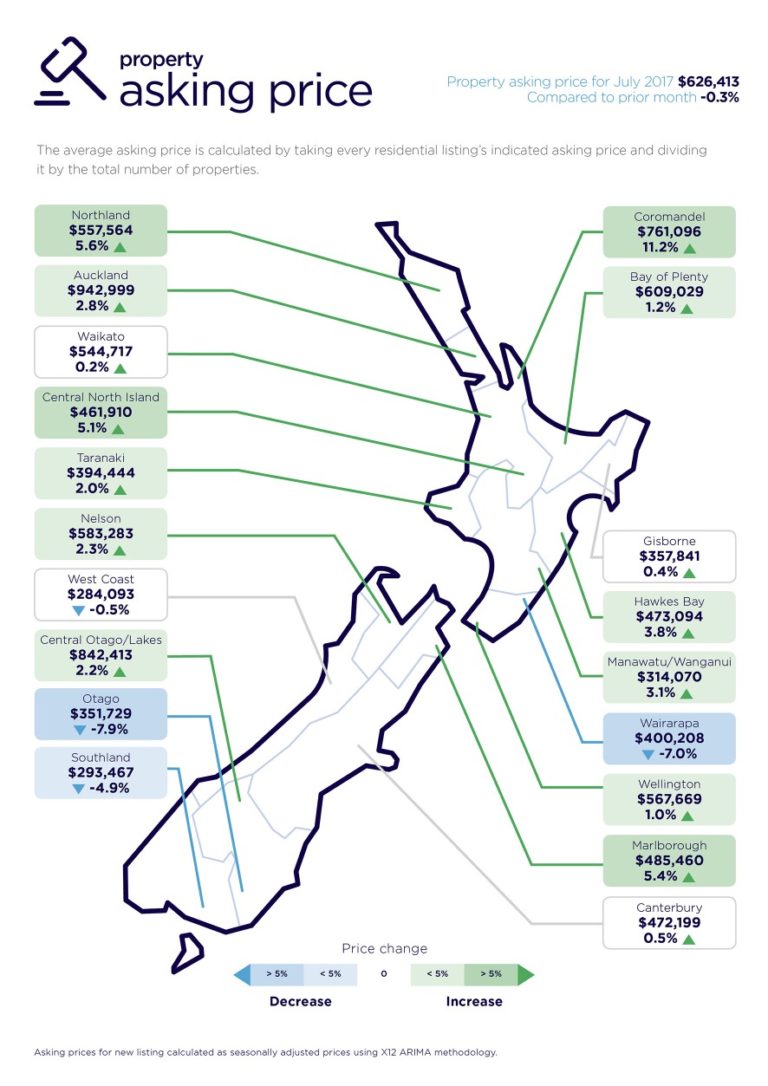
“At the same time, New Zealand’s average asking prices for homes fell by only 0.3 per cent compared with the prior month.”
“It’s a situation which we will be watching closely,” says Vanessa Taylor.
“It’s a classic case of supply and demand. We have seen a tightening in supply along with a decrease in demand which means a stable price environment.”

Static Auckland market hangs in the balance
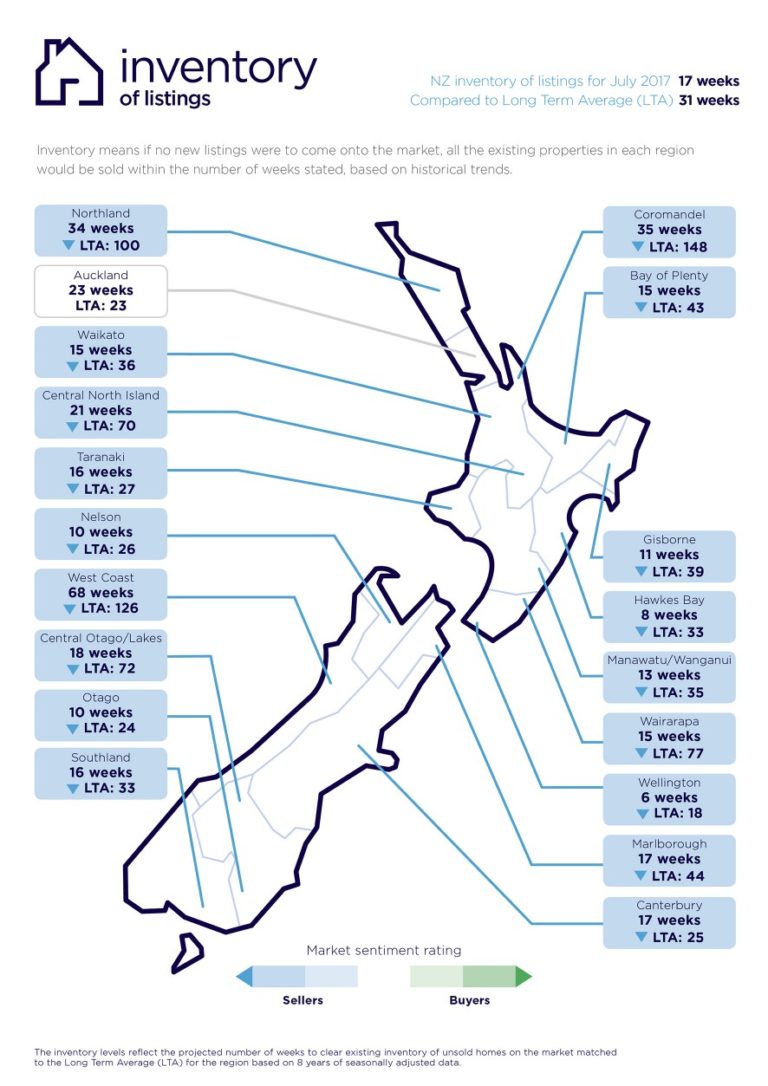
The Auckland region in particular is at an interesting stage in the property cycle, says Vanessa. “In every other region in the country, it’s still a sellers’ market, as measured by the inventory of listings,” she says. “But Auckland was delicately poised between a buyers’ and sellers’ market in July,” she says.
Inventory of listings means that theoretically if no new properties were to come onto the market from today, Auckland’s property stock would ‘sell out’ in 23 weeks.
“We will be watching with interest to see if this trend continues. If it does, it could indicate a shift towards a buyers’ market in Auckland. The last time we saw a buyers’ market in Auckland was February 2011,” she says.

New property listings in the main regions North Island regions with the greatest falls in new property listings in July compared to the previous year were Waikato (down 27.0 per cent), Bay of Plenty (down 26.3 per cent), and Taranaki (down 22.4 per cent).
By comparison, new property listings in Auckland fell by 13.9 per cent.
In the South Island, Central Otago/Lakes new listings in July fell 32.4 per cent compared July 2016, while Otago listings dropped by 28.8 per cent.

Bucking the trend of static property asking prices
While property asking prices nationally only fell by 0.3 per cent in July compared to the previous month, four regions bucked the trend, with lifts in asking prices of more than five per cent. The Coromandel led the way with a 11.2 per cent lift in asking prices compared to the previous month, followed by Northland (5.6 percent), Marlborough (5.4 per cent) and Central North Island (5.1 per cent). At the other end of the scale, the largest falls in asking price for July compared to June were in Otago (down 7.9 per cent) and the Wairarapa (down 7 per cent). Glossary of terms
• Average asking price gives an indication of current market sentiment. Statistically, asking prices tend to correlate closely with the sales prices recorded in future months when those properties are sold. As it looks at different data, average asking prices may differ from recorded sales data released at the same time.
• Inventory is a measure of how long it would take, theoretically, to sell the current stock at current average rates of sale if no new properties were to be listed for sale. It provides a measure of the rate of turnover in the market. • New listings are a record of all the new listings on realestate.co.nz for the relevant calendar month. As realestate.co.nz reflects 97 per cent of all properties listed through registered estate agents in New Zealand, this gives a representative view of the New Zealand property market. • Seasonal adjustment is a method realestate.co.nz uses to better represent the core underlying trend of the property market in New Zealand. This is done using methodology from the New Zealand Institute of Economic Research.
• Truncated mean is the method realestate.co.nz uses to provide statistically relevant asking prices.
The top and bottom 10 per cent of listings in each area are removed before the average is
calculated, to prevent exceptional listings from providing false impressions. • Demand: the comparative view per listing change, by new listing in the previous 3 months compared to the same time last year
Being the only provider of real estate data in real time, realestate.co.nz offers valuable property market information not available from other sources.
Report produced by realestate.co.nz and reproduced with permission.

Brent Palmer – Professional Real Estate Consultant
He has helped many people buy and sell homes in the Nelson, Stoke and Richmond areas for years, and would love the opportunity to help you as well.
Thinking of selling your home? I have a real passion for helping people sell their homes in our Nelson and Tasman Region, as well as the marketing, social media & advanced technology for home selling that goes along with it. I’d love to have the opportunity to sit down with you discuss how we can work together to get you the best price.
I help people buy and sell real estate in the following Nelson and Tasman towns & neighbourhoods: Wakefield, Brightwater, Hope, Appleby, Redwood Valley, Mapua, Stoke, Tahunanui, Atawhai and of course, Richmond and Nelson City. Connect with Brent on Facebook and pretty much everywhere else.
Know someone who needs help with real estate?
Be rewarded and REFER them here


